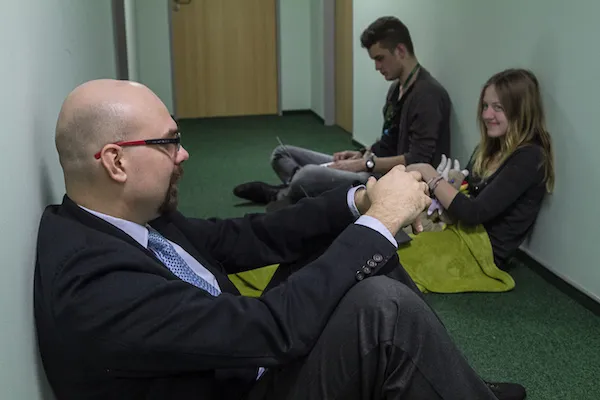
D3.js workshop at ICM for KFnrD
9 Feb 2016 | by Piotr Migdał
24-29 Jan 2016 I had a workshop for gifted high-school students of the Polish Children’s Fund (Krajowy Fundusz na rzecz Dzieci) entitled Interactive Data Visualization. It was a part of workshops in practical computer science, at ICM, University of Warsaw, organized by @bolikowski.

My intent was to show data visualization so they can start with getting data, and end up with a publicly-accessible data visualization.
Monday morning was for lectures introducing to the topics (others were: Image Analysis and Clustering of Languages). Monday afternoon to Thursday evening - work of students, with some guidance. Friday morning - presentation of their results.
I had 5 participants (3 girls, 2 boys), who had background mostly in algorithms, with C++ as their primary language.
Materials
- Slides: Interaktywna wizualizacja danych w d3.js (in Polish… but mostly pictures)
- Motivational examples: Simpson Paradox, Nutrient Contents – Parallel Coordinates, Immersion, How Americans Die, Explained Visually
- General data visualization
- Data looks better naked
- 7 reasons you should use dot graphs
- Meaning + Beauty in Data Vis and Data Art - Data vis should be as pretty as possible but not prettier
- Edward Tufte, The Visual Display of Quantitative Information - a classic book
- Willard C. Brinton, Graphic presentation - a book (1939), freely accessible on archive.org
- JavaScript
- Learn X in Y minutes, where X=JavaScript (telling that they should skip part about prototypes); mostly syntax, but it was enough
- MDN JavaScript - as a reference
- Eloquent JavaScript - a thing that I typically recommend for learning JavaScript and programming (but didn’t use it in this case)
- D3.js intro
- D3.js - additional tutorial and references
- D3.js - specific aspects
- d3 categorical colors & Google colors - use nice colors, not e.g.
#00ff00oryellow - Modifying Graph Parameters
- Notes on coincidence graphs and community detection in JS
- d3 categorical colors & Google colors - use nice colors, not e.g.
- My links with overview (in Polish)
- My projects (selected)
- TagOverflow - coincidence of tags from the Stack Exchange network
- Map of KFnrD fellows and their interests, years 1997-2013
- Hackpad for sharing links (to materials, data, projects, solutions to their particular projects). I find it more convenient that sending emails over and over (especially as 2 boys joined it the second day) and for plain text is is better than Google Docs (clear indication who added which line; no font size/style)
- Setting local server (
$ python2 -m SimpleHTTPServerthen open http://localhost:8000) - Git - for version control
- Try Git for learning how it works and in general GitHub help
- GitHub Pages for publishing their visualizations
- Habit of looking up code on websites with visualizations (hopefully).
- I should have shown:

Fruits
Maybe the most important - what were their projects?
- Julia Bazińska, Influences of Philosophers - as of Wikipedia
- Anna Urbala, Star Wars Actors
- Zuzanna Opała, Jobs on Stack Overflow
- Dominik Kufel, Bible Cross-Reference Visualization
Comments
I was extremely happy with the participants. I knew in advance that they were not “normal students”, but still - got impressed by their motivation to learn, and that each of them made a project in this short timespan. Moreover, they self-learned and applied quite a few things I hadn’t shown. I was not sure if starting with JavaScript syntax was enough. But it turned about that (as they knew C++), it was fine - and I think a good trade-off, given the time constraints.
I had a few data pieces in mind, but let them to choose their topic. It introduced some initial chaos, but I wanted to makes sure they have data they like and they are able to pick a sensible dataset.
Some projects required data wrangling, which they did in C++, C# and Perl. I was tempted to show Python but it was not enough time. I only showed one Python script (Jupyter Notebook) to scrape Stack Overflow Jobs data and explained it step by step.
Force-directed graph is a black hole - once I showed it, all of the participants wanted to use it. I have mixed feelings about it - I love them (TagOverflow, Themes of Polish Books, etc), but it is more high-level than the core D3.js API. And projects were not as diverse as they might have been.
